One could argue that data is the backbone of today’s healthcare, providing the necessary information that helps medical professionals diagnose, treat and care for their patients.
Further, the quality of this data is just as important as the quantity. High-fidelity data, a term used to describe data that is accurate, reliable and complete, is perhaps the most helpful, valued, informative and coveted type of data among healthcare professionals.
High-fidelity data provides a level of detail and precision that can possibly help to better identify patterns in patients’ conditions and lead to improvements in predictive analytics and better future outcomes.
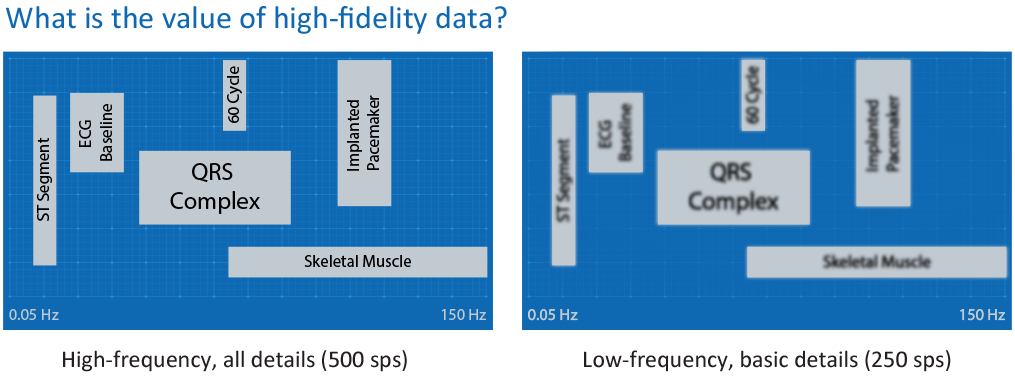
This is because high-fidelity data has a considerably higher capture rate (or frequency) than that of low-fidelity data – for example, 500 samples-per-second (sps) compared to 250 sps. Capturing a patient’s physiological data – such blood oxygen levels (SpO2), heart rhythm, heart electrical activity – by bedside and point-of-care monitoring devices at such a high speed provides many more points of information for use in making clinical assessments and decisions. Plus, the frequency of data-capture makes it possible to generate waveforms to show complex patterns and changes in a patient’s vitals over time.

In addition, high-fidelity data adheres more closely – shows more “fidelity” — to the original physiological data recorded from a bedside patient device. Think of the difference in accuracy between measuring heart rate on a wearable wrist device versus a diagnostic-quality electrocardiography (ECG) sensor.
The availability of live-streaming, high-fidelity data from bedside devices is great for clinicians near their patients, but remote clinicians and those not viewing data on point-of-care monitoring devices can also benefit from reviewing high-fidelity data.
Electronic health records (EHRs), the gold-standard for housing patient vital information, can play a role in collecting and storing high-fidelity data, but most EHRs contain low-fidelity data. EHRs usually receive physiological data from bedside and point-of-care devices as the “mean,” or “average,” of values over a certain time, or as the most recent value over the last one-to-five-minute time period.
This means most EHRs cannot offer high-fidelity waveforms or any continuous waveform data, which poses a challenge for those conducting research or reviewing patient information related to sentinel events, where precise, complex data sources are important pieces.[1]
Retrospective analysis, looking back at data to determine what factors might have contributed to a particular clinical outcome or event, requires high-fidelity data.
High-quality data gives medical researchers and clinicians the level of detail they need to better be able to study the efficacy of treatments and identify patterns and trends in healthcare outcomes.[1]
High-fidelity data is most often used for clinical trials, precision medicine and development of personalized treatment plans, epidemiology, and outcomes-based research, which necessitates information on patients’ health status before and after treatment, as well as any side effects or adverse events.
Quality improvement teams also rely on high-fidelity data to obtain the long-term information and waveform, numerics and alarm data that they need to create and improve preventive care protocols.
Desaturation, or a “desat event,” occurs when the level of oxygen in a person’s blood drops to dangerous levels. According to the American Academy of Sleep Medicine, desaturation episodes are one of the main reasons for the development of complications associated with Obstructive Sleep Apnea (OSA), one of the most common causes of sleep-disordered breathing (SDB) in children.[2] OSA in children is associated with significant morbidity, potentially impacting long-term neurocognitive and behavioral development, as well as cardiovascular outcomes and metabolic homeostasis.[2]
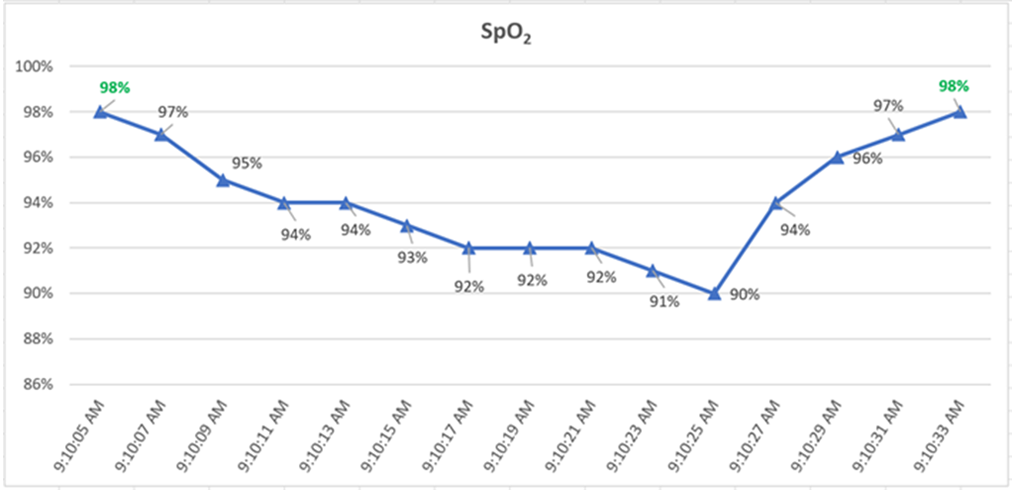
The average number of desaturation episodes per hour can be measured using Pulse Oximetry (SpO2) and is called the oxygen desaturation index (ODI). Desaturation episodes are generally described as a decrease of 4% or more in the mean blood-oxygen saturation level for at least 10 seconds within a single 120 second interval. Any respiratory event during sleep with a 3% drop in blood oxygen levels is counted toward the total, according to the American Academy of Sleep Medicine.[2]
In a low-fidelity data example, an EHR would receive either the last value in an interval, which could be 98%, or the average value over that interval, which would be 95%. In either case, the EHR data would not be able to flag a desat event as described by the ODI criteria established above. Similarly, if an SpO2 waveform (such as from a plethysmograph, or “pleth”) is needed as evidentiary data to assess the accuracy of the SPO2 values, most EHRs will not receive or store these waveforms. This hinders advancement in developing clinical decision support and quality improvement algorithms to aid in early and accurate diagnosis and subsequently a timely plan of treatment.


In a recent study “A Continuous Late-Onset Sepsis Prediction Algorithm for Preterm Infants using Multi-Channel Physiological Signals from a Patient Monitor,” researchers were focused on developing an explainable late-onset sepsis (LOS) prediction algorithm based on continuously measured multi-channel physiological signals that can be applied to a bedside patient monitor for preterm infants in a neonatal intensive care unit (NICU). The study highlights the complementary predictive value of motion information for LOS prediction when combined with cardiorespiratory information. The algorithm uses features that contain information on heart rate variability (HRV), respiration, and motion, based on continuously measured physiological waveforms, including electrocardiogram (ECG) and chest impedance (CI). Here, high-fidelity data is critical, for example, in evaluating beat-to-beat heart rate to calculate heart rate variability (HRV) statistics as one of the parameters for prediction.[3]
Heart rate variability (HRV) is a measure of the variation in time between consecutive heart beats, and it is considered to be an important indicator of the overall health and function of the autonomic nervous system. HRV is used to assess the balance between the sympathetic and parasympathetic branches of the autonomic nervous system, which control many of the body’s unconscious functions, such as heart rate, blood pressure, and breathing.[3]
Calculating HRV requires accurate and reliable data on heart rate. High-fidelity data for HRV is typically obtained using specialized medical devices, such as electrocardiogram (ECG) monitors that are specifically designed to measure heart rate.[3]
The potential benefits of using high-fidelity data for calculating HRV include:
Improved accuracy: High-fidelity data provides more accurate measurements of heart rate, which is crucial for accurate HRV calculations. This is especially important for individuals with health conditions that can affect heart rate, such as arrhythmias, which require more precise measurements to accurately assess HRV.
Reduced noise: High-fidelity data is less prone to noise and artifact, which can significantly affect HRV calculations. For example, low-fidelity data, such as data obtained using wrist-worn fitness trackers, may be impacted by movement or other sources of noise, leading to inaccurate HRV calculations.[4]
Long-term monitoring: High-fidelity data can be used for long-term monitoring of HRV, allowing healthcare providers to track changes in HRV over time and respond to changes as needed. This is important for individuals with chronic health conditions that can affect HRV, as well as for athletes and others who are interested in tracking their fitness and health.
Leaders of today’s healthcare organizations expect clinicians, medical researchers, quality teams and other clinical department stakeholders to navigate and spearhead the transformation of health care to a more value-based approach that uses data in a way that strengthens care, improves outcomes and patient satisfaction and controls costs.
Philips Clinical Insights Manager (CIM) is a web-based application for review, search, and extracting high-fidelity patient data. Clinical Insights Manager provides full high-fidelity waveform data, alarm information, and high-resolution numerical data at one second and beat-to-beat intervals.
As a cloud-based solution, Clinical Insights Manager enables research collaboration and data sharing using both identified and de-identified high-fidelity data. Storage to an enterprise-wide cloud helps enable broad clinical programs focused on research and innovation and allows clinicians to extract patient data into files that can be used for research or to help facilitate quality improvement initiatives.
Further, Clinical Insights Manager offers the security controls to help protect sensitive patient information, potentially enabling the safeguards to better withstand cyberattacks and comply with global privacy regulations.
High-fidelity data, offered through Clinical Insights Manager, supports clinicians and researchers with data they need to help drive change, innovation and better precision medicine.
Find out more about Philips Capsule Alarm Insights Manager and Clinical Insights Manager.
Jennifer Rist is a Senior Product Manager for Clinical Analytics at Philips Capsule.
Learn more about Alarm Insights Manager and Clinical Insights Manager.
Download